In 2024 I served as an expert witness asserting the maximum amount of sunlight that basketball courts in a fieldhouse would receive through their windows.
Using the dimensions of the floor, the latitude and longitude of the fieldhouse, its orientation, the height and dimensions of the windows, and conventional constants and approximations for the eccentricity of Earth’s orbit and the effective angle of the sun to the horizon, I was able to determine whether a specific point on the fieldhouse floor was receiving sunlight at any given time of day. To the right is the cumulative product, a day-by-day representation of each square foot of the fieldhouse floor’s UV exposure over the course of a year.
I started with the map and the dimensions of the windows:
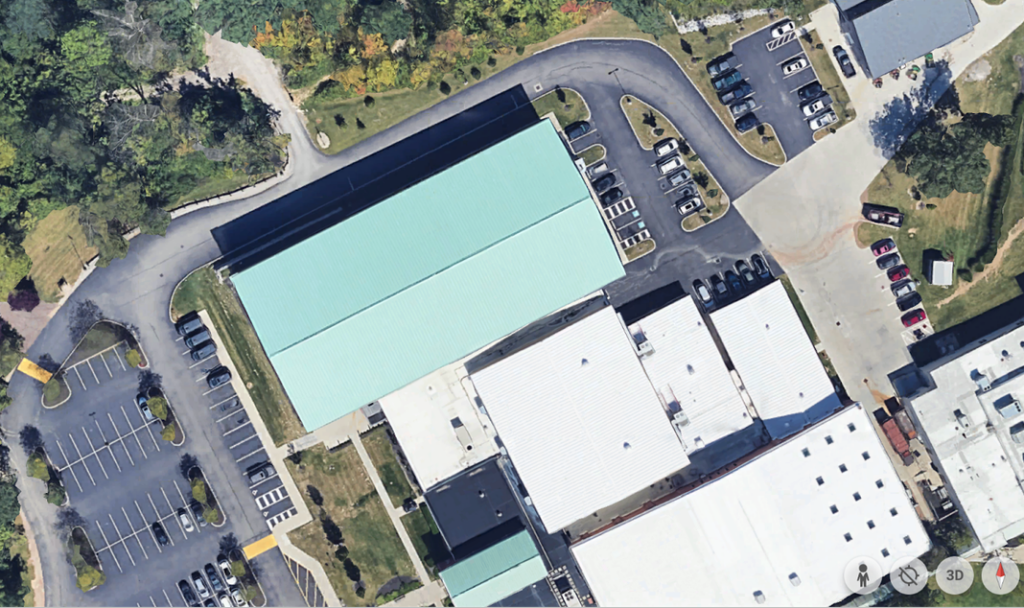
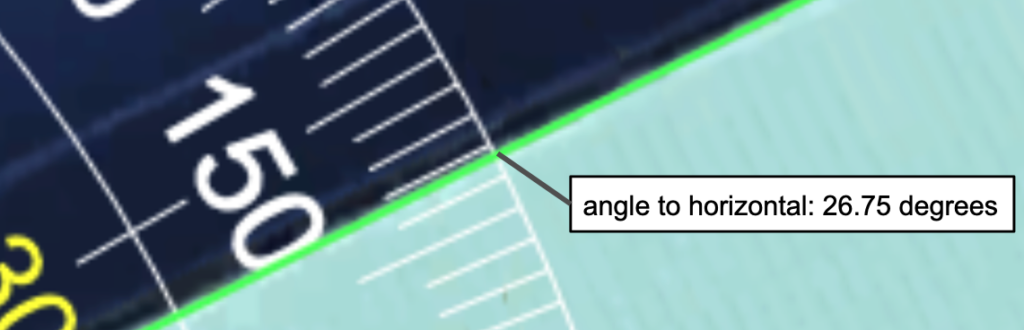
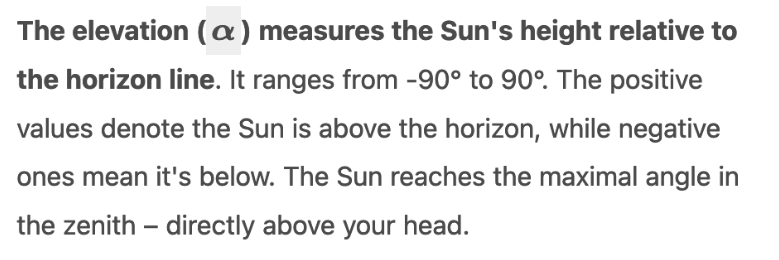
I found this website in my literature review – which told me about elevation and azimuth – the pictures below are taken directly from the website.
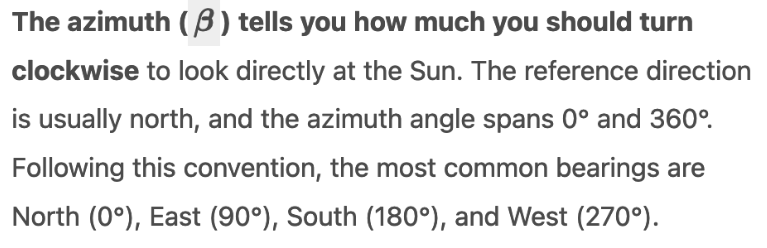
The azimuth and the elevation can be determined from the latitude and longitude of your location on the earth using the following equations:
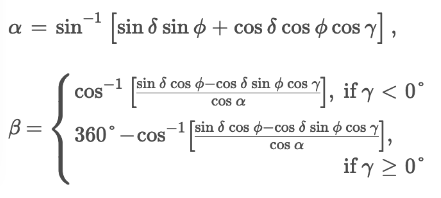
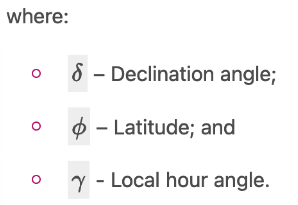
Declination angle is conveniently defined for us as well:
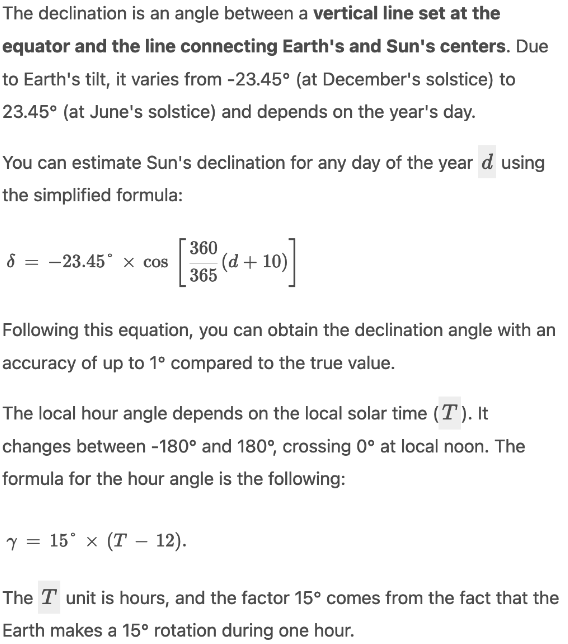
That’s not the end of the story though, because the length of a day changes depending on whether we are closer or further from the sun because of the eccentricity of Earth’s orbit. Here is a gif from the Wikipedia page for the Equation of Time depicting the complete effect of a non-perfect orbit:

I appreciated the way this website explained things.
The simpler website here tells us that:
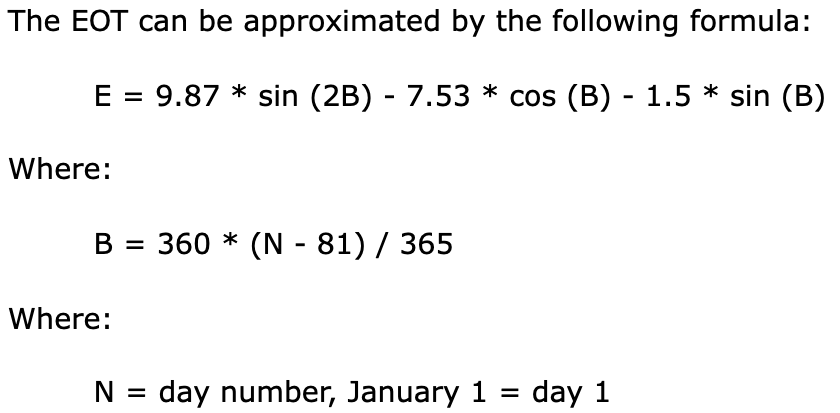
… and E is added to the local time to determine the solar time. Now we can calculate the local solar time T at any time which means we can calculate declination angle which means we can calculate the azimuth of the sun, the angle made between perfect north and the sun’s location.
SunCalc can do this for you for any specific time of day and any location. It has an awesome interface:
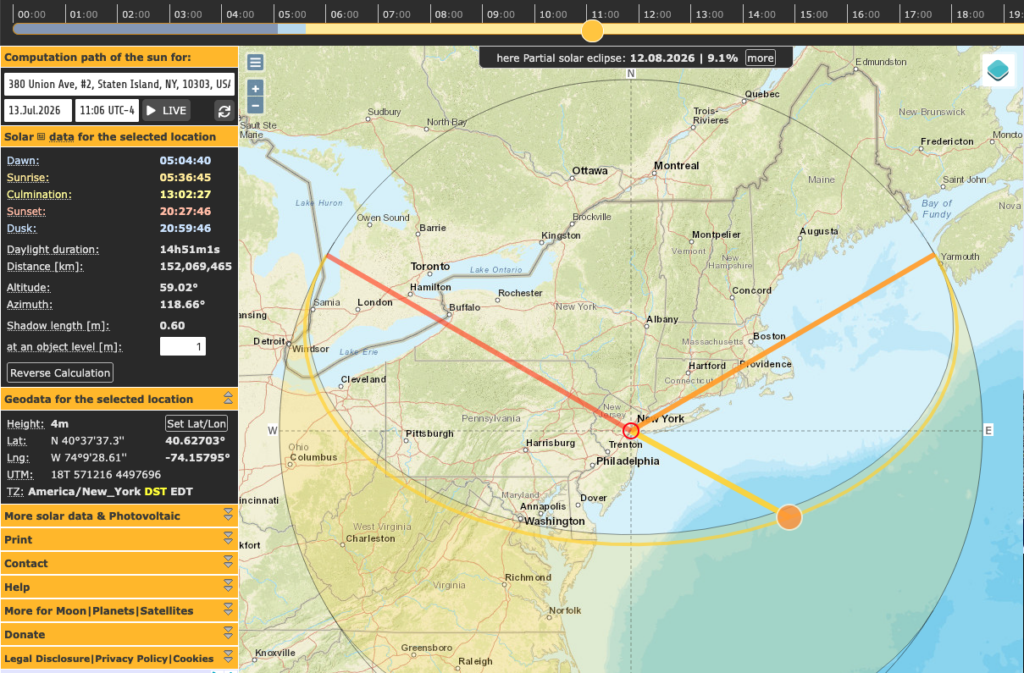
You can see that there is a slider at the top for what time of day it is and a crescent at the bottom showing how the angle that the sun makes with that location at that point in the year.
What we would be looking for is a simulation of a year’s worth of SunCalc’s to be represented in some sort of efficient format for all points concerned in the simulation.
Because the difference in latitude and longitude across three basketball courts is negligible, I didn’t use any raytracing, and instead created many objects called “SquareFoot” that could take in the time of day and use the geometry of the windows on the wall and their (x, y) locations to determine whether a straight path existed between that patch of ground and the sun.
I used this strategy to create heatmaps for individual days and overlay the heatmaps onto the actual floorplan, and then created the overall simulation. Below are alternate renders for the spring, summer, and fall solstices. Note how the sunlight experienced by each square foot moves with each day as the sun’s angle to the Earth changes with the seasons. More oblique light in the winter, and more intense/overhead light in the summer.
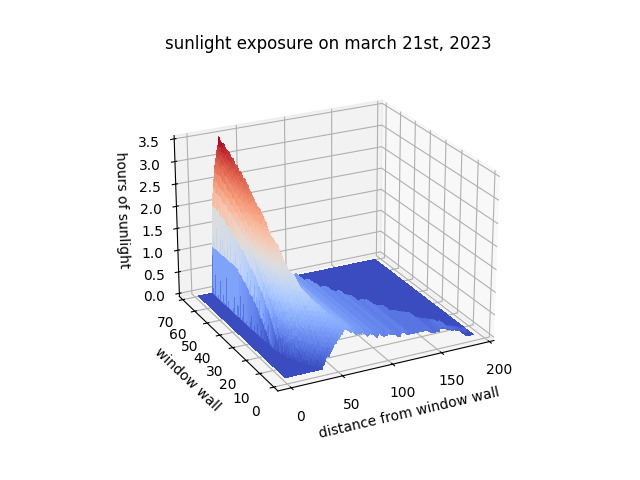
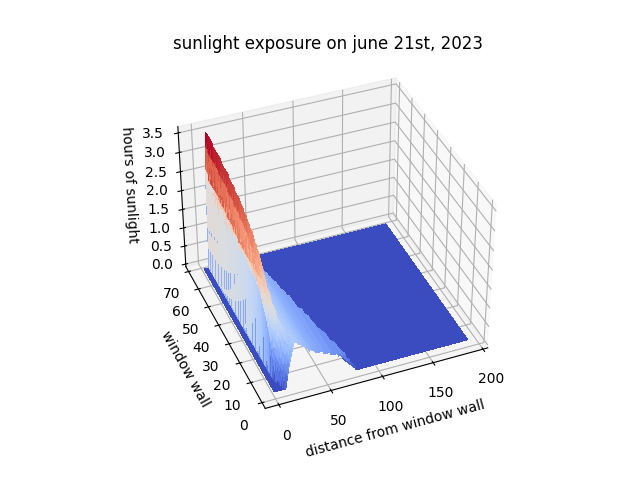
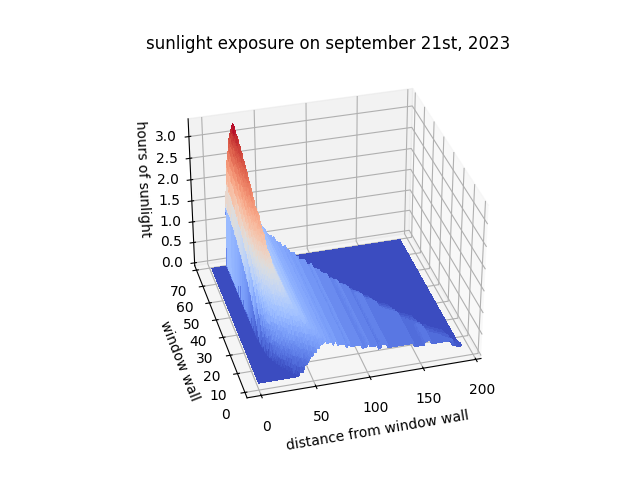
This was before AI, so the way that made sense for me to do the video was to export each graph from matplotlib as a png, and then use ffmpeg to stitch everything together.
Also, notably, the final deliverable mainly concerned the amount of sunlight experienced over the course of the year for certain (x,y) positions on the courts, and the visualizations served to check my work, but the deliverable was three durations and an image of the floor plan with three arrows for each location’s amount of sunlight.